Understanding the amount of shared audience among brands could be useful for strategic brand collaborations, which are very likely to happen among brands which share goals, business direction but also the target market. This analysis shows which brands have the most users in common, using dynamic networks in order to visualize the shared social users throughout the entire fashion weeks.
Main Findings
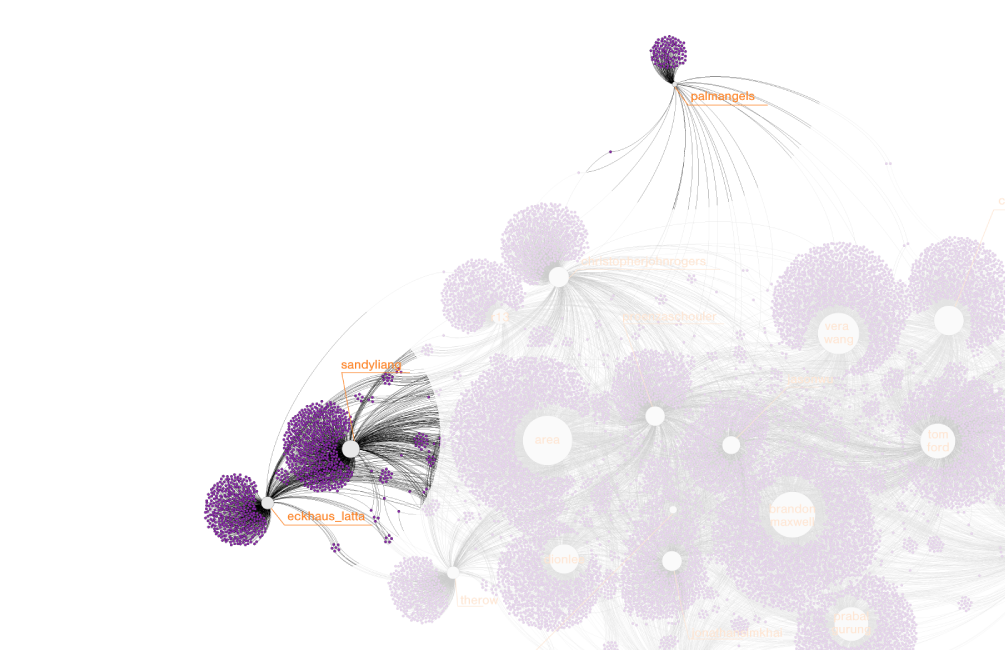
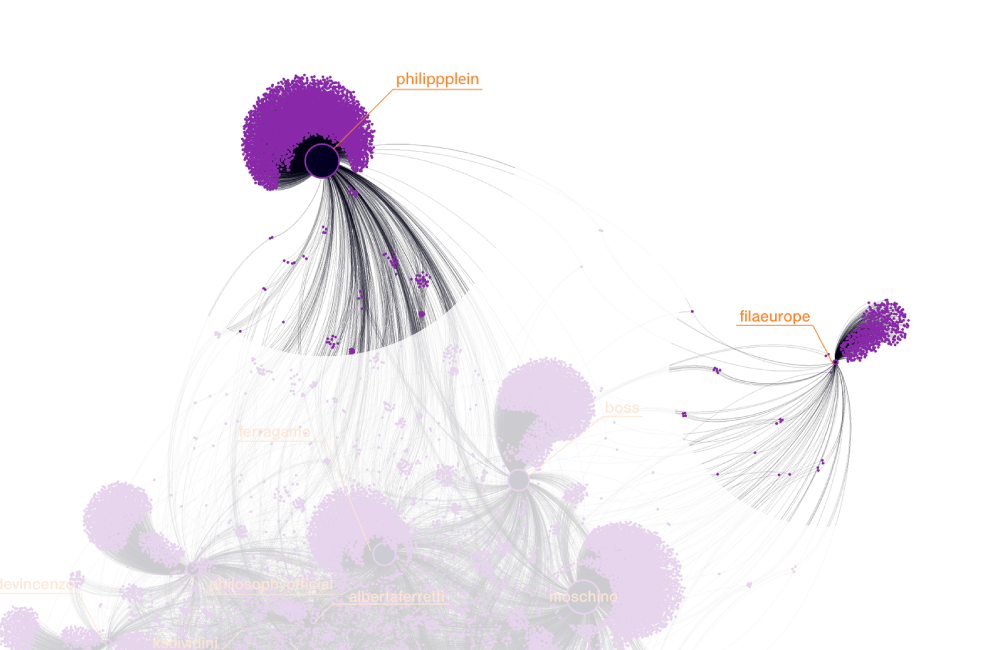
It is possible to notice that brands in the middle of the network are those ones which share the most users with other brands, while instead the ones which are on the edges share the less users with other brands.
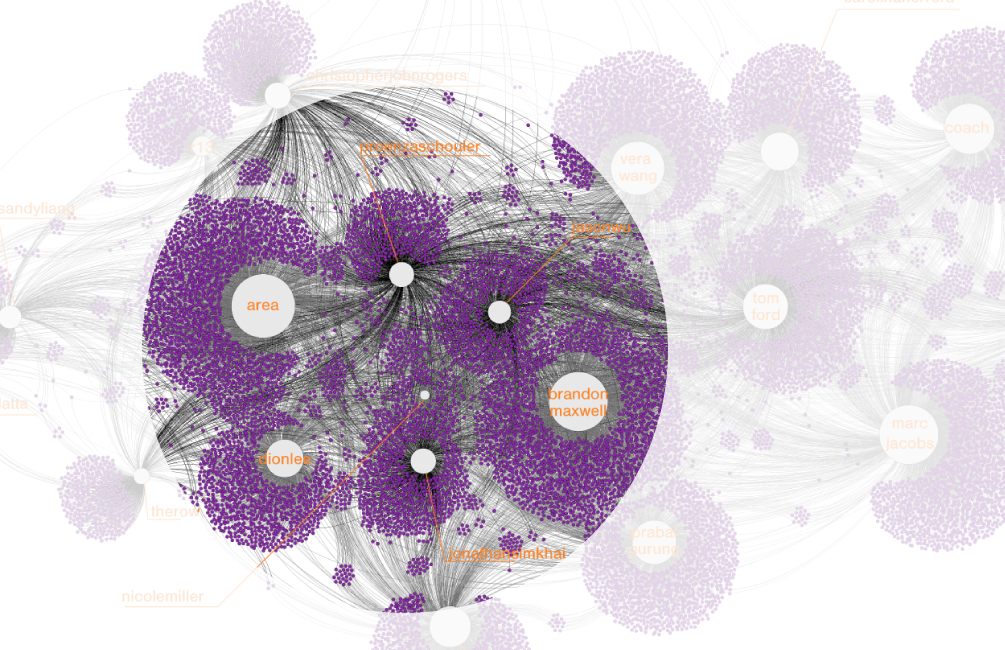
Concerning New York network, it is visible that brands such as palmangels, sandyliang and eckhaus_latta have their own dynamics and do not share much users with other brands, some other brands instead share lots of users with others, and as a consequence they are placed in the middle of the network, such as proenzashouler.
The same behaviour as New York network can be seen in Milan network, in which brands such as filaeurope and philippplein are very far from the center of the network, where there are brands like maxmara, gdcswear and albertaferretti that share almost the same slice of users.
Protocol
